
Hypnotic Wave Pendulum ✨
Creates a pendulum wave that draws mind-blowing patterns using pendulums of slightly different lengths - master physics and steal the show at the science fair!
🎯 General objective.
Build and demonstrate a wave pendulum that evidences visual patterns produced by the superposition of oscillations with slightly different periods.
👤 Personal objective
Explain in your own words why hypnotic figures appear and how depend on the length of each pendulum, the period and the assembly errors.
🌍 Theoretical introduction (without headache)
A simple pendulum takes a certain time to go back and forth: we call this the period (T). If you align many pendulums with slightly different lengths, their periods also change a little bit. By releasing them at the same time, their movements will be will deprecate and, when viewed as a whole, will form wave patterns that come and go as if it were magic. But it's not magic: it's physics! ⚙️
- 🔁 Period: time of a complete oscillation. For a small pendulum, T ≈ 2π√(L/g).
- 📏 Length (L): dominates the period; small variations → large visual effects.
- 🌀 InterferenceThe combination of oscillations produces figures that appear and disappear.
🔬 Scientific method: your plan of attack.
- Observation: Pendulums show undulating patterns when they have different lengths.
- Question: How does varying the length at period and to the patterns visible?
- Hypothesis: If I increase the length, the period grows and the group pattern changes, lengthening the re-phase time.
- Experimental design: Set of N pendulums with gradual lengths; period measurement and video recording.
- Experimentation: Simultaneously release and measure times for each pendulum and for the re-phase cycle.
- Analysis: Period vs. root length plot; contrast with T ≈ 2π√(L/g).
- Conclusions: Evaluates whether the data support the hypothesis; discusses errors and improvements.
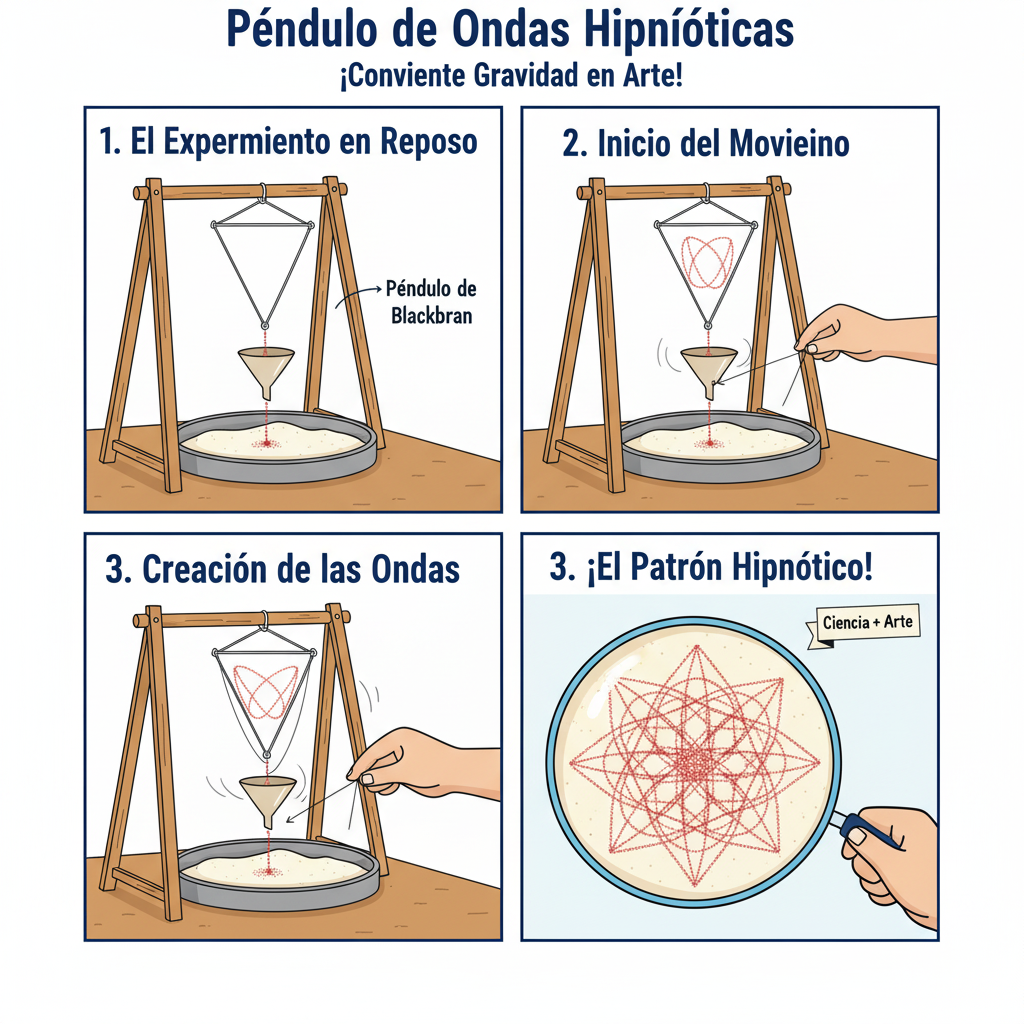
🧩 How does the assembly look?
A top bar (wood/metal) holds several ropes. On each string hangs a nut/sphere. The lengths increase slightly from left to right. When they are released at the same time, the wave appears.
Top bar
┌──────────────────────────────────────────────┐
│ o o o o o o o o o o o o o o o o o (knots) │ ← holes or hooks.
└┬──┬──┬──┬──┬──┬──┬──┬──┬──┬──────────────────┘
 │ │ │ │ │ │ │ │ │ │
 │ │ │ │ │ │ │ │ │ │
 ● ● ● ● ● ● ● ● ● ● ● ● ● ← masses (nuts/beads).
 ^ ^ ^ ^ ^ ^ ^ ^
 L1 L2 L3 ...              LN (L1 < L2 < ... < LN)
📐 Dimension recommendations
- Number of pendulums: 10-15 (enough for colorful patterns).
- Length difference between neighbors: 1-2 cm (adjustable according to space).
- Separation between ropes: 3-4 cm to avoid collisions.
- Bar height: ≥ 50-70 cm above the masses.
🛠️ BOM with smart options
| Material | Economic | Standard | Professional |
|---|---|---|---|
| Top bar | Recycled straight ruler/wood | 1×2 pine lath with perforations | Aluminum profile with rail and hardware |
| Rope/yarn | Resistant cotton thread | Thin nylon or fishing line | Calibrated monofilament/thin kevlar |
| Masses | Reused metal nuts/rings | 10-20 g steel spheres | Calibrated spherical weights (laboratory) |
| Support | Stacks of books + ribbon | Tripods/table stands | Laboratory stand with heavy base |
| Tools | Scissors, tape, ruler | Bar drill, markers | Caliper and spirit level |
| Measurement | Cell phone timer | Slow Motion App (60-120 fps) | Motion sensor / photo door |
Choose according to budget and required accuracy. The key is to maintain small differences length between neighboring pendulums.
🧭 Step-by-step guide: your adventure map
Plan the arrangement
Draw a table with N rows (1 per pendulum). Define L1 and add +1-2 cm for each next (L2, L3, ...).
Pro Tip: Start with N=12 and ΔL=1.5 cm for very fluid patterns.Prepares the bar
Mark points every 3-4 cm. Drill or place hooks. Number from 1 to N from left to right.
Scientist alert! Check that the bar is rigid and stable; vibration ruins the pattern.Cut and mount the ropes
Cut ropes to the calculated lengths (measure from the suspension point to the center of mass). Knot and check for slippage.
Add the doughs
Use similar masses for all. If they differ, the pattern may deform. Adjust knots finely.
Initial testing and synchronization
Spread them all at 5-10° and release them all at the same time. Record video to analyze and detect crashes or uneven knots.
Measures periods
For each pendulum, take 10 swings and divide the total time by 10. template.
Adjusts and improves the pattern
If two neighbors collide, it separates further. If the pattern restarts too fast, slightly increase ΔL; if it takes too long, decrease ΔL.
Explains the science
Show your graphic T vs √L. Comment on differences with theory and possible errors: air friction, yarn elasticity, initial amplitude.
🎪 Shine at the fair.
- Clear poster: Large title, schematic, key formula T ≈ 2π√(L/g), and a photo of the setup.
- Interactivity: Ask a visitor to give the release signal and try to predict the next pattern.
- Visible data: Period table and T vs √L plot.
🎤 Phrases that impress
- “We adjust the lengths to control the lag collective.”
- “The rephasing cycle depends on small differences in T between neighboring pendulums.”
- “Our graph confirms the relationship T ∝ √L Within the margin of error.”
📎 Data logging template.
| # Pendulum | Length L (cm) | Time 10 dark (s) | Period T (s) | Notes |
|---|---|---|---|---|
| 1 | ||||
| 2 | ||||
| 3 | ||||
| 4 | ||||
| 5 | ||||
| … |
Hint: use slow motion to more accurately mark crossings in the center.
✅ Checklist
- [Rigid and stable bar
- [ ] Labeled lengths (L1 < L2 < ... < LN)
- [Sufficient clearance (3-4 cm)
- [ ] Simultaneous release (countdown)
- [Data collected (≥ 3 repetitions)
- [T vs. √L graph printed
🔗 Recommended sources
- High school physics textbooks: chapter on Simple Harmonic Motion.
- Pendulum simulators (PhET, oscillation apps).
- Introductory articles on pendulum wave and length design.